Reverse Engineering
TL;DR
- The goal: understand the program behavior.
- Usually this means finding the input that makes the program output “Success!” or speeding up a slow algorithm.
Past Meetings
- Check out our Reverse Engineering Setup meeting for more details on installing our recommended tools.
Introduction
Terminology
Rev, short for Reverse Engineering, is the process of understanding computer programs. The goal is to figure out what the program does. Usually, programs are difficult to understand, either intentionally or unintentionally.
Abstractions
Abstractions are simplifications made for a programming language that hides some of the complexity to make a language easier to use.
- Abstract (higher level) programs are easier to understand
- Languages like Python and JavaScript are higher level
- Languages like assembly and C are lower level
- As you modify a program to become more abstract (to better understand it), you lose some information in the process
Static and Dynamic Analysis
- Static analysis: reading code, using tools to understand code without running it
- Good place to start, not great if there’s a lot of code
- Dynamic analysis: running code, inspecting or modifying the program as it’s running
- Generally faster, captures entire program environment
Tools
Bytecode Viewer
Installation
See https://github.com/Konloch/bytecode-viewer
When to use
This program is used to decompile Java files, which usually have the .jar extension
How to use
Simply import the java jar program into the bytecode viewer and see the decompiled java code! This works by recovering the java code from the compiled java bytecode.
Ghidra
Installation
- See our Reverse Engineering Setup meeting
- Or read the Installation Guide
When to use
Use this tool for binaries, not python scripts. Ghidra “decompiles”, or simplifies, binary programs into more human-readable “pseudo-C” code.
Ghidra is a static analysis tool.
Interface
 To open a program in Ghidra, go to File → Import File… → select the file you want to analyze.
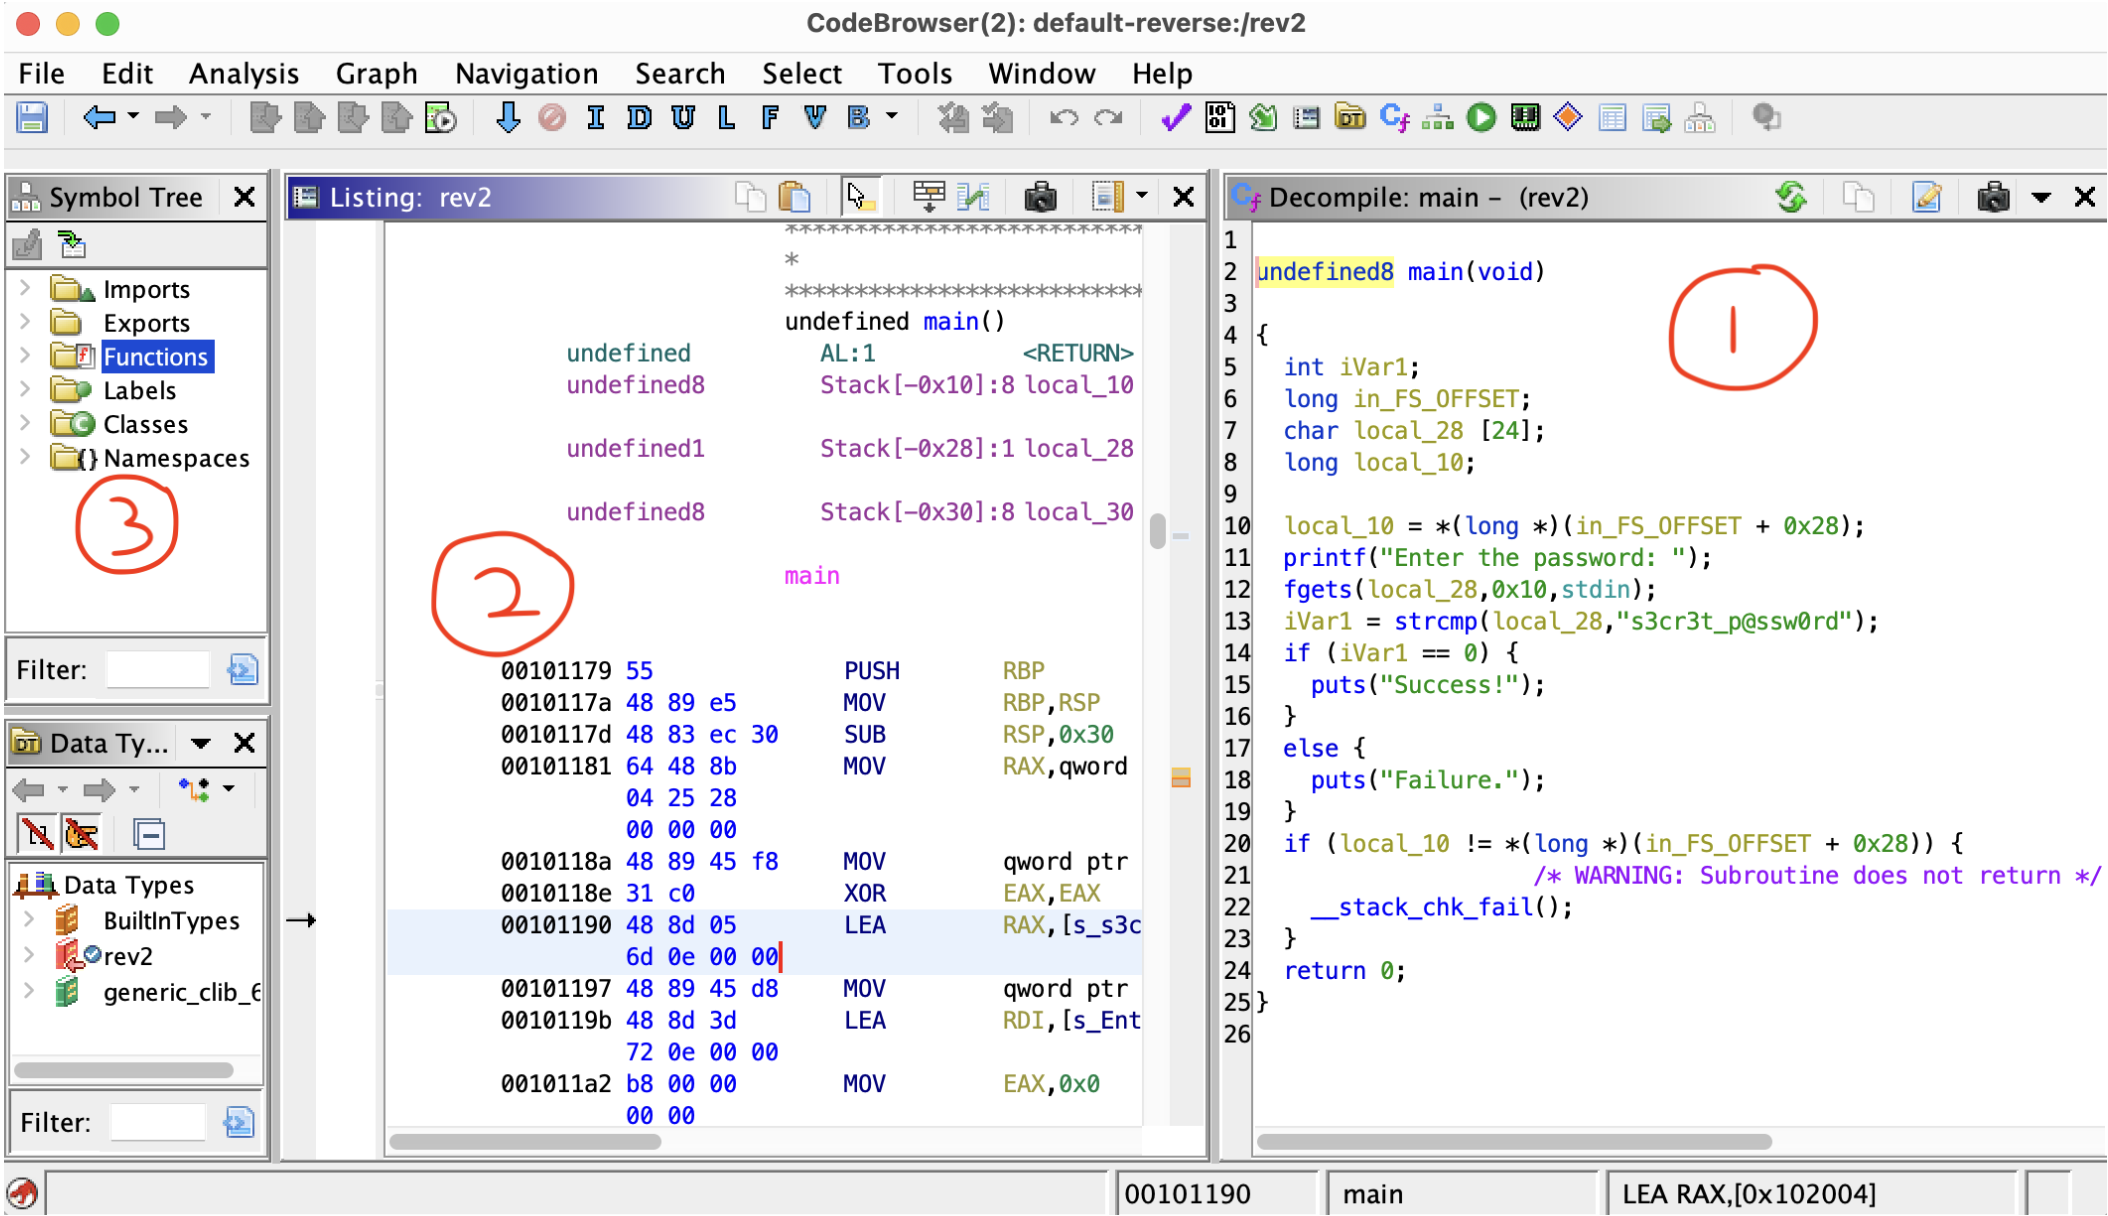
Click “OK” for all the auto analyze popups (there should be several). Now, the interface should look like the above image.
- is the decompiled code output. This is what you will be looking at for the most part. You can rename variables by clicking a variable and pressing “L”. Change the type by right clicking and selecting Retype Variable.
- is the assembly instructions. This won’t be very helpful if you don’t know assembly, and can be mostly ignored for the challenges at Fall CTF.
- is the symbol tree. This shows you dierent named values that are present in the le. Click Functions and scroll down to select the main function. This shows you the first function that runs.
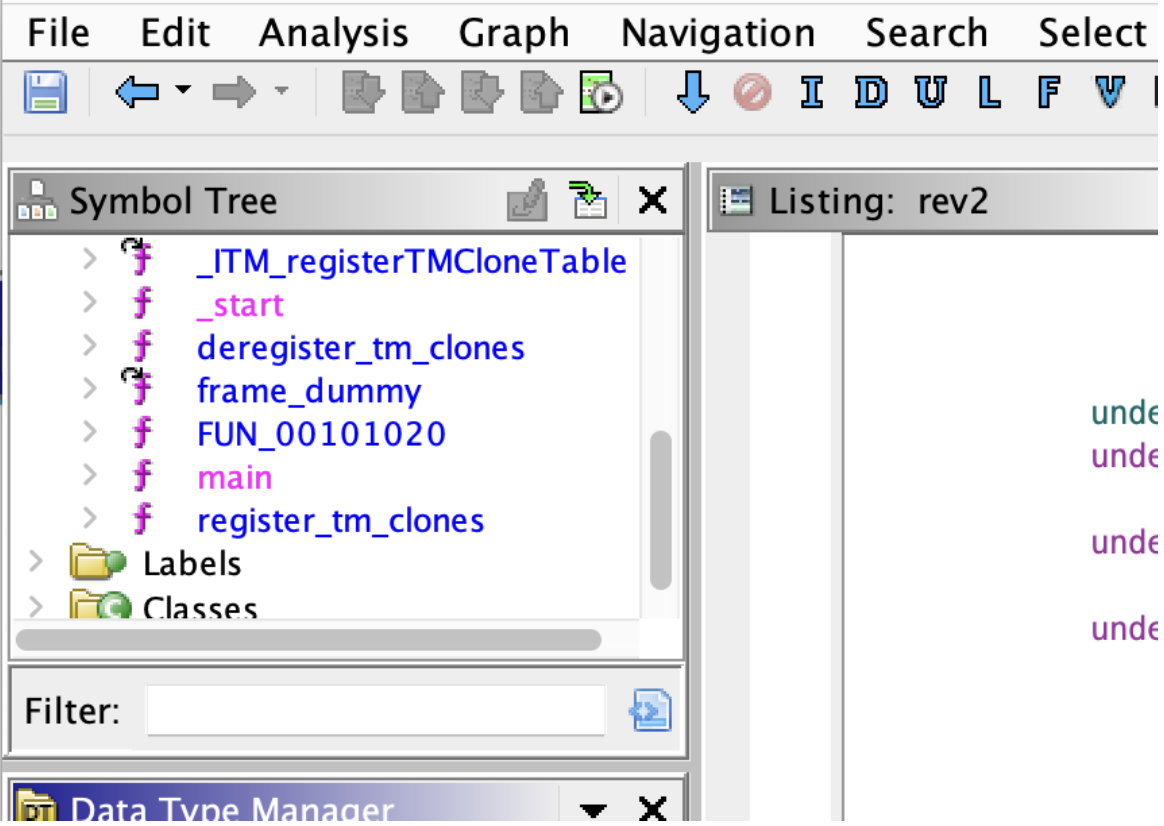
Here we can see the main function in the symbol tree. If there is no main, click _start and see what that function calls.
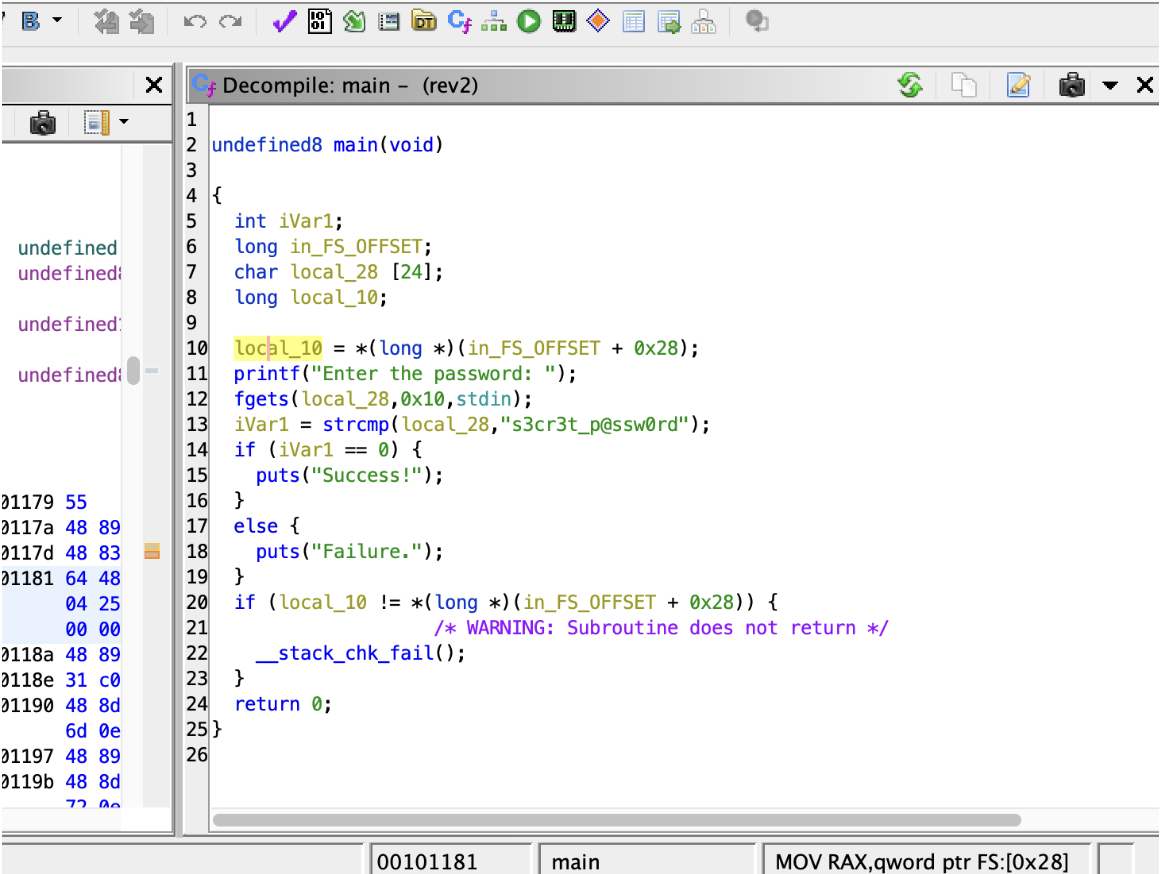
Above is a picture of the decompilation (disclaimer: this is not a challenge from Fall CTF). Almost every function you see will have an if statement with __stack_chk_fail at the bottom. This is a check for the stack canary, which is not relevant to any challenges here. It may be of more interest in pwn challenges. The “local_10 = *(long *)(in_FS_OFFSET + 0x28);” line at the top sets up the stack canary and can also be ignored.
Note that the variables are named with undescriptive names, such as iVar1 and local_28. This is because the decompiler does not know the details of variables in the original function. As a result, it has to generate variable names.
GDB
Installation
When to use
Similarly to Ghidra, use this tool for binaries, not python scripts. GDB is a debugger that runs programs, giving you the ability to stop, inspect, and modify code as it is executing.
GDB is a dynamic analysis tool.
Basics
Run gdb ./chal on the command line, where chal is the name of the program. Note that you must be on Linux (WSL works too). This will not work for Apple Silicon Mac users.
GDB will launch you into a program with a dierent terminal prompt, where each line starts with (gdb). You interact with the program by typing in commands
Commands
- misc
- help <command>: get help about any of the commands listed here
- running
- run: run the program from the start
- quit: exit GDB
- start: start the program and break on the main function
- breakpoints
- break <func>+<offset>: set a breakpoint at the function <func> with an offset <offset>. Useful to get the offset from the disas command
- inspecting the program
- disas <func>: disassemble the <func> function
- info reg: print all the registers
- x: print data (see help x for more info)
- x/4gx 0x1234: print 4 QWORDS (64-bit values) in hex starting at address 0x1234
- x/10i rip (current instruction pointer)
- x/7wx rsp (stack pointer)
- x/8bd rdi
- set: set values
- set rax to 23
- set rip
- this skips the current instruction, if it is 4 bytes long
General Workflow
- first, identify interesting places to set a breakpoint in Ghidra
- use the assembly instructions window in Ghidra to see the offset to break at
- run the program in GDB and set a breakpoint
- modify or print values as desired
- repeat until solved